Monitor Logger
Advanced System Logging & Monitoring
Monitor Logger provides centralized logging and monitoring across your entire PolySaaS stack. Collect, aggregate, and analyze logs from every bundled application — enabling proactive issue detection, compliance auditing, and operational insights.
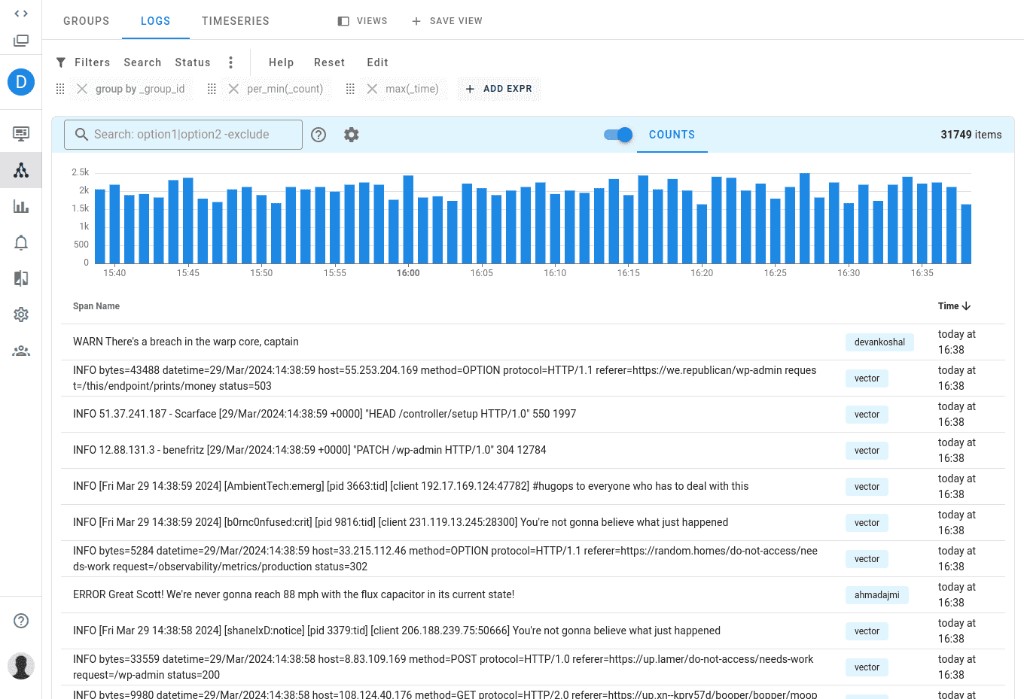
Uptrace — real-time log aggregation with search, filtering, time-series visualization, and span-level detail
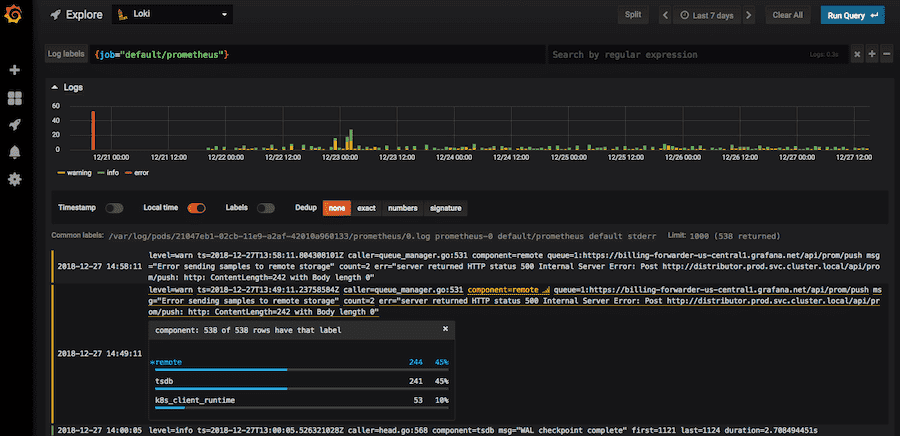
Grafana with Loki — log exploration, Prometheus integration, and real-time alerting
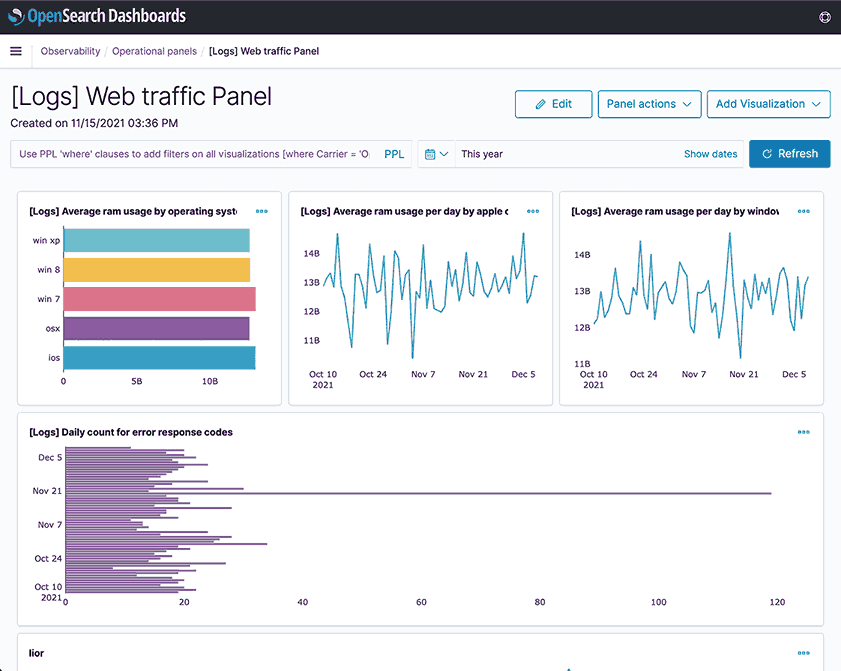
OpenSearch Dashboards — web traffic analysis, RAM usage trends, and error response tracking
Key Capabilities
Centralized Log Aggregation
Collect logs from Odoo, Nextcloud, Mattermost, WordPress, Liferay, and all other components into a single searchable interface.
Real-Time Alerting
Set thresholds and triggers for critical events. Receive alerts via Mattermost, email, or webhook when anomalies are detected.
Compliance & Audit Trail
Maintain immutable audit logs for regulatory compliance. Track who did what, when, and where across your entire platform.
Dashboard & Visualization
Visual dashboards showing log volumes, error rates, response times, and system health. Drill down from overview to individual log entries.
PolySaaS Integration
Monitor Logger watches every application in your PolySaaS stack. Alerts route to Mattermost channels, summaries appear on Liferay portal dashboards, and PolySysMon correlates log events with performance metrics for root-cause analysis.
Stop Managing Tools. Start Orchestrating Them.
Join enterprises already running smarter with PolySaaS.